We Asked
“Would existing local data demonstrate value for a mobile-first strategy for local clients and would that data show a clear opportunity for client return on investment?”
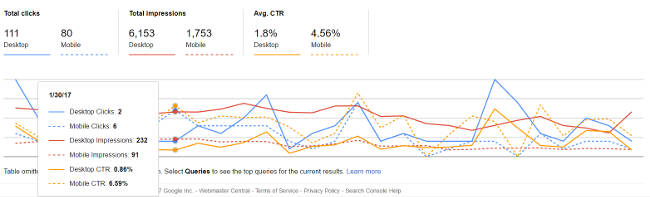
Desktop versus Mobile Clicks
Definitions
-
Clicks – Count of clicks from a Google search results page that landed the user on your property. Learn more.
-
Impressions – How many links to your site a user saw on Google search results, even if the link was not scrolled into view. However, if a user views only page 1 and the link is on page 2, the impression is not counted. The count is aggregated by site or page. With infinitely scrolling pages, such as image search, the impression might require the item to be scrolled into view. Learn more.
-
CTR – Click-through rate: the click count divided by the impression count. If a row of data has no impressions, the CTR will be shown as a dash (-) because CTR would be division by zero.
Browser and OS Traffic Over Two Year Period
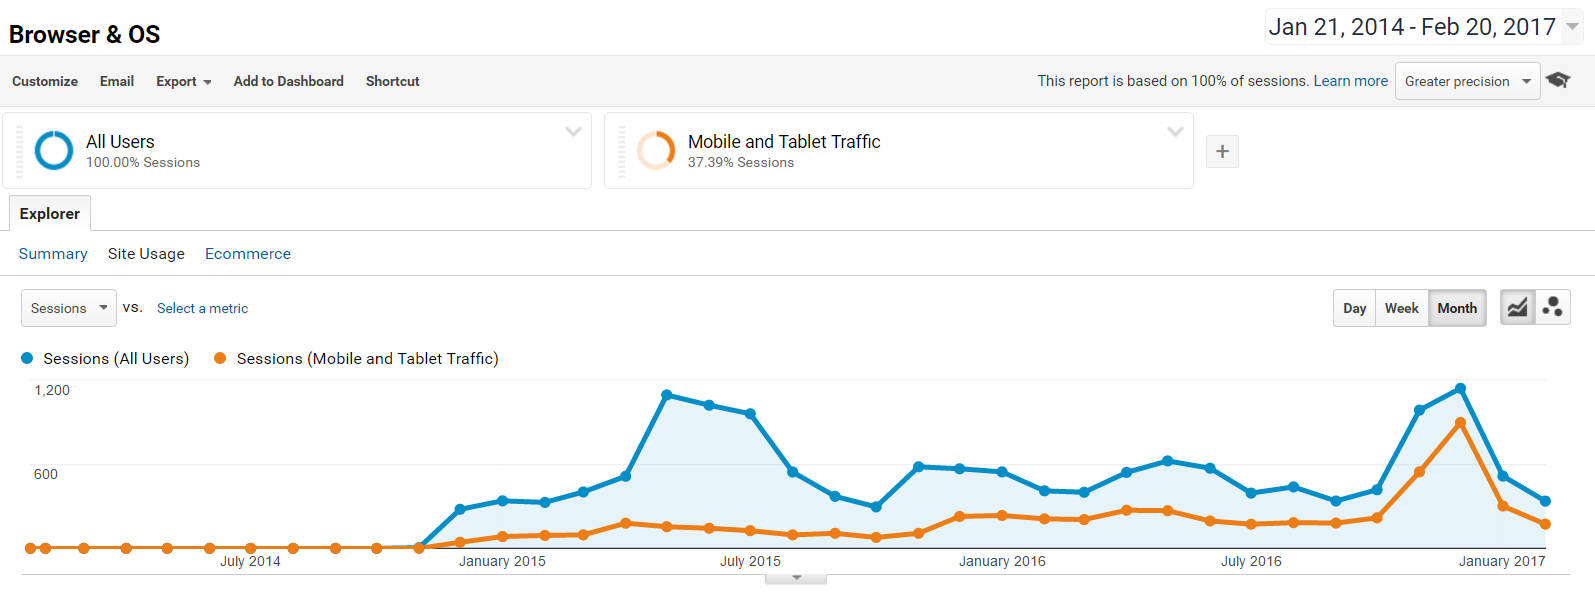
Past Three Years of Traffic sorted by Technology
In the pie chart below you can see a representative number of traffic (sessions). There was less mobile traffic to local websites than desktops. 5,579 sessions from mobile and tablet compared with 9,342 sessions from desktops. Interesting to look back at some of the best smartphones of 2013.
Past Year of Traffic by Technology
Desktop and mobile sessions are near even in number of sessions.
Past 90 Days of Traffic
Mobile has clearly emerged as the leader generating more than double the number of sessions. This graph represents approixmately 2,000 sessions from organic search results. The bounce rate is around 35%. Page load time is 4 seconds resulting in an average of 2 minutes per session. Goals such as form fills were achieved
So now we return
Historical Perspective
Nearly ten years after the iPhone was announced, Android has become a catalyst in mobile device adoption. “There are now over 24,000 distinct Android devices in use around the world from over 1,000 different manufacturers.” – Open Signal
Conclusions and Recommendations
We recommend all clients develop a mobile-first approach to their online business. This includes all clients in Hawaii and especially those in large cities. To stay connected with new and existing users a mobile strategy is necessary. A mobile-first strategy is recommended.
The mobile traffic tipping point was reached more than a year ago when mobile use superceeded desktop use for content like video, podcasts. According to Google Inside AdWords in May of 2015 “…more Google searches take place on mobile devices than on computers in 10 countries including the US and Japan.”
Then there’s this Wired statement earlier in 2015, that phones now appear to be a “more affordable device than computers for most consumers.”
A recent report from Hitwise (registration required) argues that in the US mobile search is roughly 58 percent of overall search query volume. That’s based on an average of 11 key categories and associated queries analyzed by Hitwise in its “Mobile Search: Topics and Themes” report. The company “examined hundreds of millions of online search queries” across PCs, smartphones and tablets between April 10 and May 7, 2016. –Search Engine Land
To be prepare for another leap in the number of mobile searches this year we recommend:
- Stay focused on ROI. Ensure current ad spends are less than income from ads.
- Develop a mobile-first strategy for your website. Include fast loading landing pages, directions and offers for “near me” searchers.
- Prepare internal teams to understand the shift. Prepare then to know how to properly value mobile prospects and their unique needs in all areas of sales and service.
About the Study
Research was conducted using Google Analytics and Search Console. These tools are used by our team on every website we manage. Tertiary research to confirm and correllate data was provided by comScore, Double-click and Google. This is a non-scientific study.
The study was based on traffic and search analysis over a three year period. Data was collected from 30 websites. Statistical outliers eg; sites that had missing data, sites that did not properly account for administrative or spam traffic were removed. Ultimately, ten websites were used in the final metrics. Their numbers brought into a spreadsheet and averaged. In the end we used representative , charts and graphs to highlight our findings. No personally-identifiable data was shared or used in our research.
A Plea to Clients
A portion of the mobile users we identified in the research are your customers. Hawaii residents with a need to stay connected on a budget. Right now local business owners need to consider the importance of mobile on their bottom line.
Have any questions?
[contact-form-7 id=”25081″ title=”Contact form 1″]